


CHARACTERIZATION Analysis
CHARACTERIZATION Analysis Services
This is the official page for CHARACTERIZATION Sample Analysis. In which InstaNANO provides CHARACTERIZATION analysis services to all the users Globally, which includes
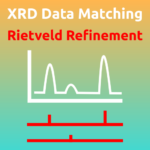
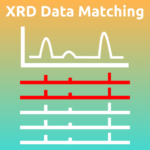
XRD Data Matching and Analysis with Rietveld Refinement Service Online
Upload your XRD data securely to InstaNANO and let our expert team handle the complete XRD analysis for you. Within a short turnaround time you will receive a comprehensive, publication-ready report. Please read below for detailed information.
File Upload Guidelines
- Supported formats: [e.g., .raw, .xy, .cif, .xrdml, .csv, .txt, etc].
- If your file format is not supported, compress it into a .ZIP file and upload.
What You Will Get
- Top 5 Phase Matches: Identification of the most probable materials matching your XRD pattern, with match percentage for each phase provided with high accuracy.
- Crystal Structure Information: Detailed lattice parameters, space group, unit cell details, symmetry and crystallographic data useful for publications and reports.
- Rietveld Refinement Results: Full Rietveld refinement performed on your matched data with goodness-of-fit parameters (R-factors, χ², etc.) and refined lattice parameters included for publication.
- Publication-Ready Outputs: Graphical plots (XRD pattern with refinement fit, difference curve, Bragg positions) and complete data files packaged in a downloadable ZIP; results provided in universal formats (Excel, Word, PowerPoint, Origin, etc.) for easy integration into your work.
- Lifetime Data Access: Results stored in your InstaNANO account, accessible anytime with no expiration, suitable for reuse in reports, theses, or publications.
Why Choose InstaNANO
- Expert Analysis - Performed by a professional team with experience in XRD data analysis and crystallography.
- Trusted by Researchers Worldwide - The reliability of InstaNANO’s results is recognized across the scientific community; our analyses have been cited by leading journals and publishers. See how our work is cited: https://instanano.com/citations/
- Secure Uploads - Your data remains safe; only accepted file types allowed for protection.
- Fast Turnaround - Get your refined XRD results for research papers within a few days.
- User-Friendly Outputs - Ready to use in your research papers, presentations, and project reports.
- Hassle-free online experience - Upload, relax, and receive complete results.
- Lifetime Storage - Never lose access to your results.
NOTE: Please browse our collection of online XRD services, including data matching, data analysis, phase identification, and Rietveld refinement: https://instanano.com/xrd-analysis-online/
XRD Data Matching and Accurate Phase Identification by Our Expert
Phase identification is the first step in understanding your material’s structure, purity, and performance. At InstaNANO, we make this process simple, fast, and reliable so you can focus on interpretation and publication rather than tedious data handling. Upload your XRD data securely to InstaNANO and let our expert team handle the complete phase identification for you. Please read below for detailed information.
File Upload Guidelines
- Supported formats: .raw, .xy, .cif, .xrdml, .csv, .txt, etc.
- If your file format is not supported, compress it into a .ZIP file and upload.
What You Will Get
- Top 5 Phase Matches: Identification of the most probable materials matching your XRD pattern, with match percentage for each phase delivered with high accuracy.
- Crystal Structure Information: Detailed lattice parameters, space group, and unit cell details, including symmetry and crystallographic data useful for publications and reports.
- Publication-Ready Outputs: XRD graph with matched peaks clearly highlighted; complete data files packaged in a downloadable ZIP; results provided in universal formats (Excel, Word, PowerPoint, Origin, etc.) for easy integration into your work.
- Lifetime Data Access: Results stored in your InstaNANO account so you can revisit or reuse your data anytime for comparison or publication updates. No expiration — ideal for reports, theses, or publications.
Why Choose InstaNANO
- Expert Analysis: Performed by a professional team with experience in XRD data analysis and crystallography.
- Trusted by Researchers Worldwide: The reliability of InstaNANO’s results is recognized across the scientific community; our analyses have been cited by leading journals and publishers. See how our work is cited: https://instanano.com/citations/
- Secure Uploads: Your data remains safe; only accepted file types are allowed for protection.
- Fast Turnaround: Get your refined XRD results for research papers within a few days.
- User-Friendly Outputs: Ready to use in research papers, presentations, and project reports.
- Hassle-free Online Experience: Upload, relax, and receive complete results.
- Lifetime Storage: Never lose access to your results.
NOTE: See a demo: https://instanano.com/xrd-data-matching/?order=DEMO.
Browse our collection of online XRD services, including data matching, data analysis, phase identification, and Rietveld refinement: https://instanano.com/xrd-analysis-online/
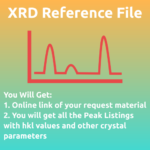
XRD Reference (JCPDS) File
Need accurate XRD reference (JCPDS) files for your materials but don’t have access to paid databases or software? InstaNANO’s team will prepare and deliver precisely formatted, verified reference files compatible with Excel, Word, PowerPoint, Origin, Match!, HighScore, and all major plotting and XRD analysis software. Provide your material name(s) and we will send clean, standardized reference data ready for use.
File Upload Guidelines
- Enter the material name in the input box.
- Request multiple materials by separating names with commas or numbers in the input box.
- Update the cart quantity to match the number of reference files you need.
What You Will Get
- Verified XRD Reference File: High-quality reference data for your requested material(s), including standard 2θ positions, d-spacing, relative intensities, and Miller indices (hkl).
- Universal Compatibility: Files formatted for use with Excel, Origin, Match!, HighScore, and any XRD analysis or plotting software; ideal for plotting, matching, and validating experimental data.
- Fast Delivery & Lifetime Access: Receive download links shortly after order confirmation and retain access through your InstaNANO account indefinitely.
Why Choose InstaNANO
- Expert Analysis - Performed by a professional team experienced in XRD data analysis and crystallography.
- Trusted by Researchers Worldwide - The reliability of InstaNANO’s results is recognized across the scientific community and cited by leading journals and publishers. See citations: https://instanano.com/citations/
- Secure Uploads - Data security with acceptance of approved file types only.
- Fast Turnaround - Receive XRD reference results within a few days for research purposes.
- User-Friendly Outputs - Deliverables ready for inclusion in research papers, presentations, and reports.
- Hassle-free Online Experience - Upload, relax, and receive complete results.
- Lifetime Storage - Persistent access to your results via your InstaNANO account.
NOTE: Please browse our collection of online XRD services, including data matching, data analysis, phase identification, and Rietveld refinement: https://instanano.com/xrd-analysis-online/
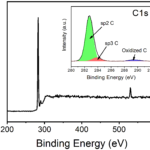
XPS Analysis Online
X-ray Photoelectron Spectroscopy (XPS) is a powerful technique for determining elemental composition, oxidation states, and surface chemistry. If you have collected XPS data but need help with interpretation, peak fitting, or quantification, InstaNANO’s expert team provides complete XPS analysis including peak deconvolution, atomic percentage calculation, chemical-state identification, and high-quality publication-ready figures. Our goal is to make your XPS data clear, meaningful, and ready for research papers, theses, and industrial reports.
File Upload Guidelines
- Upload raw spectra files exported from your instrument along with any processed files or project files you have.
- Include survey scans and high-resolution scans for regions of interest (for example C 1s, O 1s, N 1s, and relevant metal peaks).
- Provide measurement details and acquisition settings (instrument, acquisition parameters, calibration references, and any charging correction applied).
- Specify which regions you want deconvoluted, your preferred output formats, and any publication or figure requirements.
What You Will Get
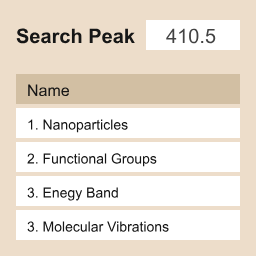
- Elemental / Functional Group Percentage Calculation: Accurate calculation of atomic percentage (%) of elements present in your sample and quantification of functional groups, chemical states, and bonding environments as permitted by the scanned regions.
- Peak Area Values & Fitting Parameters: Detailed tables containing peak area values, FWHM, peak positions, and other fitting parameters to verify fitting quality and support quantitative interpretation.
- Deconvoluted Peaks & Publication-Ready Graphs (if selected): Professionally fitted and deconvoluted core-level regions (C 1s, O 1s, N 1s, metal peaks, etc.) with high-resolution graphs showing raw spectra, individual components, and the final fitted curve.
- Raw Deconvolution Data: Exportable raw fit data for further analysis or record keeping.
- Tables of Fitted Parameters: Comprehensive tables summarizing all fitting parameters used and resulting component assignments.
- High-Quality Graph Files: Graphs provided in high-quality formats (PNG, PDF, or other formats on request) formatted for publication.
Why Choose InstaNANO
- Expert-Level XPS Interpretation: Your XPS data is analyzed by specialists with deep experience in surface chemistry, peak fitting, and spectroscopic analysis.
- Accurate & Reliable Outputs: Results include proper background subtraction, curve fitting (Gaussian/Lorentzian/Voigt), and validated chemical-state assignments.
- Publication-Ready Figures: All graphs are formatted for international journals with clean legends, labels, and color coding.
- Trusted by Researchers Worldwide: InstaNANO is used by students, researchers, laboratories, and industries globally; our results have been included in research papers, theses, books, patents, and industrial reports. See citations: https://instanano.com/citations/
- Fast Turnaround: Receive processed XPS results within a few working days.
- User-Friendly & Hassle-Free Experience: Upload your XPS files and let our experts handle the full analysis.
- Lifetime Storage: Your results remain stored in your InstaNANO account for future reference.
NOTE: Please browse our collection of online XPS services: https://instanano.com/xps-analysis-online/
Raman Crystallite Size Calculator by Our Expert Team
Determining the in-plane crystallite size is essential for characterizing carbon-based materials like graphene, carbon nanotubes, and graphite. This parameter directly correlates with defect density, electrical conductivity, and mechanical strength. At InstaNANO, we ensure your crystallite size values are derived with scientific rigor using the Tuinstra-Koenig relation. Upload your Raman data securely, and our specialists will analyze your spectrum using precise peak deconvolution, producing results ready for inclusion in your research or publication.
File Upload Guidelines
- Supported formats: [e.g., .txt, .csv, or .xls etc].
- If your file format is not supported, simply compress it into a .ZIP file and upload.
What You Will Get
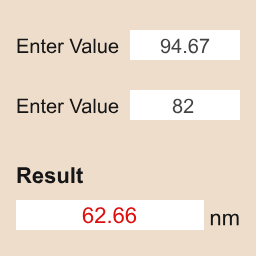
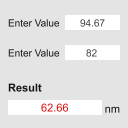
- Accurate Crystallite Size Value: Get the exact in-plane crystallite size calculated using the Tuinstra-Koenig relation and based on the specific laser excitation wavelength used. Includes calculation of the ID/IG ratio to quantify the degree of disorder (defects) versus graphitization.
- Detailed Calculation Report: Includes graphical representation of the deconvoluted D and G bands with baseline correction and provides all key parameters: peak positions, FWHM, integrated areas, and the final crystallite size.
- Ready-to-Use Outputs: Results provided in easy-to-edit formats (Excel, Word, Origin, CSV); graphs and tabulated data ready for inclusion in papers, theses, and reports.
- Lifetime Data Access: Your analysis results are stored permanently in your InstaNANO account and remain accessible for comparison or citation.
Why Choose InstaNANO
- Expert Analysis: Performed by a professional team experienced in Raman spectroscopy and carbon nanomaterials.
- Trusted by Researchers Worldwide: The reliability of InstaNANO’s results is recognized across the scientific community; our analyses have been cited by leading journals and publishers, demonstrating precision and credibility. See how our work is cited: https://instanano.com/citations/
- Secure Uploads: Your data remains safe; only accepted file types are allowed for protection.
- Fast Turnaround: Get your Raman results for research papers within a few days.
- User-Friendly Outputs: Ready to use in research papers, presentations, and project reports.
- Hassle-free online experience: Upload, relax, and receive complete results.
- Lifetime Storage: Never lose access to your results.
NOTE: Please browse our collection of online analysis services, including XRD analysis, band gap calculation, and FTIR interpretation, at https://instanano.com/analysis-services-online/
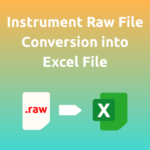
Instrument Raw Data File Conversion to Excel File
Have FTIR, XRD, NMR, or UV-Vis instrument files that your software cannot read or export? Upload them to InstaNANO and we will convert them into clean, ready-to-use Excel files. Our expert team handles your data securely and ensures accurate conversion so you can easily plot, analyze, compare, and include the results in your research. Upload your file and receive a perfectly formatted Excel output compatible with major analysis and plotting tools.
File Upload Guidelines
- Accepted Instruments: FTIR, XRD, NMR, UV-Vis.
- Upload Note: Some common instrument file formats are restricted for security reasons. If your file will not upload, compress it to ZIP format (.ZIP) and then upload.
- NMR Supported Files: Zip Files (.ZIP), Agilent / Bruker Ion Trap (.YEP), Agilent ChemStation (.MS, .CH), Bruker Aspect 2000/3000, Briker MS Data, Bruker TopSpin/UXNMR/XWIN-NMR, Bruker WIN-NMR (.FID, .SER, .1R, .RR), Bruker XMass, CS ChemDraw (.CDX, .CDXML), Chemical Markup Language (.CML), ElViS OPUS (.0), ElViS Omnic SPA / Galactic GRAMS SPC (.SPA, .SPG, .SPC), GE/Nicolet, JEOL Lambda (.NMFID, .NMDATA, .NMF, .NMD), JEOL MSQ1000 (.SPE), JEOL msAxel (.RBS, .RBC, .RPS, .RPC), MS CSV File (.CSV, .TXT), Magritek Prospa (.1D, .2D), MestReC (.MRC), MestReNova (.MNOVA .MNPAG, .MNCS, .MNPL, .XML), Molfile (.MOL), NMRPipe (.FID, .FT1, .FT2), NetCDF ANDI-MS (.CDF), Nuts Type 1/2/3, Old Gemini, Oxford Instruments RINMR (.RiDat), PCA Model (.MPCA), Publications Submitted Data (.MNPUB), QOne, QOneTec (.NMR), SDfile (.SDF), SIMPSON (.FID, .SPE), Siemens MagnetomV Vision (.RAW), StereoSitter Projects (.JSON), SwaN-MR, Techmag (.TNT), ThermoScientific Xcalibur (.RAW), Varian Gemini/VXR from VHelper, Varian VNMR, Varian/Chemagnetics Spinsight, Waters MassLynx (.DAT, .IDX, .INF, .RPT), PerkinElmer block structure file (.SP), mzXML/mzData (.mzXML, .mzData, XMLl).
- XRD Supported Files: PANalytical XRD Measurement (.XRDML, .RD, .SD, .FP, .DI, .UDF, .UDI, .LIS), BRUKER (.RAW, .LST, .UXD), STOE (.PRO, .DAT), SEIFERT (.ASC), SKROWONEK UDS2 (.UDS), LH-Rietveld (.LHP), DBW-Rietveld (.RFL), Crystallographic Information (.CIF), JCAMP (.JDX, .JCP), ICDD (.PD3), MDI JADE (.MDI), ICSD Database (.CRY).
- FTIR Supported Files: Spectra / Groups (.SPA, .SPG), JCAMP-DX (.JDX), PCIR (.IRD, .IFG), Nicole SX/DX (.NIC, .SPC), CSV Text (.CSV), Peak Solve (.0), GRAMS (.SPC, .GLD), Perkin-Elmer (.SP), Spectacle (.IRS, .SDA, .UVD), GAML (.GAML), BRUKER (.[0-9]), Jasco (.JWS), Mattson (.IGM, .ABS, .DRT, .SBM, .RAS, .TRN).
- UV-Vis Supported Files: Spectrum (.SPC), Photometric Files (.PHO), Kinetics (.KIN), Report (.rpt).
What You Will Get
- Converted Excel File: A cleaned, well-formatted Excel (.xlsx) file converted from your instrument raw data for direct use in analysis and plotting.
- Compatibility: Files usable with Excel, Word, PowerPoint, Origin, and other analysis/plotting tools.
- Ready-to-Use Data: Properly extracted and organized columns for easy plotting, matching, and analysis.
- Lifetime Access: Converted files are saved in your InstaNANO account for indefinite access.
- Secure Delivery: Confidential handling and secure file transfer back to you.
Why Choose InstaNANO
- Accurate & Professional Conversions: Files are processed by experts to ensure precise extraction and proper formatting of spectral and instrument data with no missing points or unreadable tables.
- Trusted by Researchers Worldwide: InstaNANO’s analytical services are used in universities, research centers, and industries; our results have been cited in publications. See how our work is cited: https://instanano.com/citations/
- Secure & Confidential Uploads: Only accepted file types are allowed and all conversions are handled with strict confidentiality.
- Fast Turnaround: Receive your converted Excel file within 1-2 working days after placing the order.
- Hassle-Free Online Experience: Upload → Relax → Download your converted file.
NOTE: Please browse our collection of online analysis services: https://instanano.com/analysis-services-online/
DSC Percent Crystallinity Calculation – Accurate & Reliable Results by Experts
Determining percent crystallinity via Differential Scanning Calorimetry (DSC) is essential for understanding the thermal properties, structural integrity, and performance of polymers and semi-crystalline materials. At InstaNANO, we derive crystallinity values with scientific rigor using the enthalpy of fusion method. Upload your DSC data securely, and our specialists will analyze your thermogram using precise baseline integration and peak area determination to provide an accurate percent crystallinity value, ready for inclusion in your research or publication.
File Upload Guidelines
- Supported formats: [e.g., .txt, .csv, .xls, .xlsx, or instrument-specific exported files].
- Ensure your file contains Temperature (or Time) vs. Heat Flow data.
- Provide the reference enthalpy value for a 100% crystalline sample if known; otherwise, our experts will use standard literature values for your material.
- If your file format is not supported, simply compress it into a .ZIP file and upload.
What You Will Get
- Accurate Percent Crystallinity Value: Get the exact percentage of crystallinity in your sample, calculated by comparing the experimental heat of fusion with the reference enthalpy for a fully crystalline material.
- Detailed Calculation Report: Includes graphical representation of the integrated melting peak, baseline selection, and all key parameters: onset temperature, peak temperature, enthalpy of fusion ($\\Delta H_m$), and the final percent crystallinity.
- Ready-to-Use Outputs: Results provided in easy-to-edit formats (Excel, Word, Origin, CSV); graphs and tabulated data ready for inclusion in papers, theses, and reports.
- Lifetime Data Access: Your crystallinity results are stored permanently in your InstaNANO account and remain accessible for comparison or citation.
Why Choose InstaNANO
- Expert Analysis: Performed by a professional team with extensive experience in thermal analysis and polymer science.
- Trusted by Researchers Worldwide: The reliability of InstaNANO’s results is recognized across the scientific community; our analyses have been cited by leading journals and publishers, demonstrating precision and credibility. See citations: https://instanano.com/citations/
- Secure Uploads: Your data remains safe; only accepted file types are allowed for protection.
- Fast Turnaround: Get your DSC analysis results for research papers within a few days.
- User-Friendly Outputs: Ready to use in your research papers, presentations, and project reports.
- Hassle-free online experience: Upload, relax, and receive complete results.
- Lifetime Storage: Never lose access to your results.
NOTE: Please browse our collection of online analysis services, including TGA interpretation, XRD analysis, and molecular weight determination, at https://instanano.com/analysis-services-online/
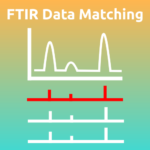
FTIR Data Matching Online
Understanding the chemical composition and functional groups present in your material is a critical step in validating your synthesis, confirming purity, and preparing publication-ready results. At InstaNANO, we make FTIR interpretation effortless: simply upload your FTIR spectrum securely to our server and our expert team will analyze it thoroughly to deliver highly accurate, easy-to-use results. This service provides quick, precise, and publication-ready FTIR insights for researchers, students, and industry professionals without the hassle of manual peak matching or searching large databases.
File Upload Guidelines
- Supported file formats: .txt, .csv, .spa, and other common FTIR instrument formats.
- If a file does not upload due to format restrictions: compress it into a .ZIP file and upload.
- Required data: Ensure your file contains wavenumber vs. absorbance/transmittance data for best results.
What You Will Get
- Top 20 Material Matches (Highly Accurate): A detailed list of the closest matching materials based on your FTIR spectrum, including similarity percentage, compound name, and corresponding library name; helps confirm whether your synthesized compound is correct or identify unknown materials.
- Overlay Graphs With Top 5 Matching Materials: Clean overlay plots comparing your FTIR spectrum with the top 5 most similar materials, with peaks aligned and visually contrasted to verify structural similarity and functional group overlap; ideal for research papers, theses, reports, and presentations.
- Clean, Organized Output: All results packaged in a downloadable ZIP containing graphs, tables, and editable files ready for insertion into journal manuscripts, lab reports, or presentations.
- Lifetime Data Access: Your FTIR results are stored securely in your InstaNANO account with no expiry; revisit, re-download, or reuse files anytime, useful for theses, reviews, or long-term R&D projects.
Why Choose InstaNANO
- Expert-Level Interpretation: Your data is analyzed by specialists experienced in vibrational spectroscopy, material characterization, and advanced spectral matching algorithms.
- Trusted by Researchers Worldwide: InstaNANO’s analytical services are used by students, professors, laboratories, and companies; many research papers and theses have cited results generated through our platform. See how our work is cited: https://instanano.com/citations/
- Secure Data Uploads: Only safe and verified formats are allowed to maintain data security; your files remain confidential and are never shared with third parties.
- Fast Turnaround: Receive complete FTIR analysis results within a few days, enabling you to move quickly with your research, publications, or project deadlines.
- User-Friendly, Hassle-Free Experience: Just upload and let us handle the full analysis; you receive outputs that are ready to use instantly in your work with no additional processing required.
- Designed for Researchers Who Value Quality: Accurate matches, clean data presentation, and editable files ensure your workflow stays smooth, error-free, and professional.
NOTE: Please browse our collection of online FTIR services, including data matching, data analysis, graph plotting, and written manuscript-ready reports: https://instanano.com/ftir-analysis-online/
Sample Instrument Analysis (Run) Service - Professional Laboratory Scans (India Only Product)
Obtain high-quality raw characterization data for your synthesized or commercial materials through InstaNANO’s professional laboratory services. Whether you need XRD, FTIR, SEM, or TGA scans, our calibrated instruments provide the precision and reliability required for academic research, peer-reviewed publications, and industrial quality control. This service is designed for researchers who need high-resolution raw data delivered in universal, easy-to-analyze formats without the need for in-house instrumentation.
Sample Submission Guidelines
- This service is currently available for customers within India only.
- Solid powders or pellets are preferred for XRD, FTIR, and TGA; ensure samples are dry and contamination-free.
- For SEM, samples must be stable under vacuum; professional gold coating is included as standard to ensure high-resolution imaging.
- Clearly label all samples and package them securely before shipping to our facility.
- Shipping instructions and our courier address will be shared immediately after order placement.
- Custom Parameters: If your research requires non-standard scan ranges, specific atmosphere control, or different heating rates, please contact us via WhatsApp or email for a custom quotation before placing your order.
What You Will Get
- XRD Raw Data: Accurate diffraction data covering a 10°–90° 2θ range at a standard 5°/min scan rate, provided in Excel-compatible formats for phase verification and crystallinity studies.
- FTIR Spectra: High-quality infrared spectroscopy scan providing wavenumber vs. transmittance/absorbance data, ideal for functional group validation and chemical bonding analysis.
- SEM Imaging: 6 high-resolution scanning electron microscopy images highlighting material morphology and surface structure, including gold coating for enhanced clarity on non-conductive samples.
- TGA Thermal Profile: Comprehensive thermogravimetric analysis from 50°C to 800°C at a 20°C/min heating rate, provided as raw weight loss (%) vs. temperature data.
- Fast Turnaround & Lifetime Access: Receive your raw data within 7–21 working days. All results are stored permanently in your InstaNANO account for future downloads and citations.
Why Choose InstaNANO
- High-Precision Scans: Samples are analyzed using well-calibrated, research-grade instruments to ensure scientific reproducibility and accuracy.
- Trusted by Researchers Worldwide: Our laboratory services are widely cited in leading journals and utilized by top universities and industries globally. See our citations: https://instanano.com/citations/
- Simple & Transparent Process: No hidden costs or complex procedures; just straightforward sample acquisition and digital data delivery.
- Hassle-Free Online Experience: Ship your samples, relax, and download your results from your personal dashboard.
- Expert Support: Managed by a professional team with deep expertise in materials characterization, spectroscopy, and nanotechnology.
NOTE: This service includes instrumental scans only. For detailed interpretation, peak fitting, or Rietveld refinement, please browse our Online Analysis Services.
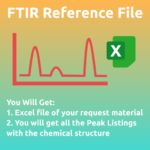
FTIR Reference File Online
Need accurate, publication-ready FTIR reference files for your materials but don’t have access to expensive databases or advanced software? Let InstaNANO’s expert team prepare and deliver verified, standardized FTIR reference data ready for direct use in your FTIR plotting, matching, and analysis work. Simply provide the material name(s) you need, and we will deliver clean, structured files compatible with Excel, Word, PowerPoint, Origin, GraphPad, Python, MATLAB, and all major plotting tools.
File Upload Guidelines
- Provide the material name(s) and any sample identifiers you want included.
- Specify your preferred delivery format or plotting tool (Excel, Word, PowerPoint, Origin, GraphPad, Python, MATLAB, or other).
- Attach any reference spectra, peak annotations, or notes if available to aid verification and curation.
- If you have specific requirements for peak reporting or intensity normalization, state them when ordering.
What You Will Get
- Verified FTIR Reference File: High-quality reference data for your requested material(s), including characteristic peak positions and standard intensity values for validating experimental spectra and preparing research-ready figures.
- Universal Compatibility: Reference files delivered in formats compatible with Excel, Word, PowerPoint, Origin, GraphPad Prism, Python, MATLAB, and more so you can easily plot, overlay, compare, or match with your experimental FTIR data.
- Fast Delivery & Lifetime Access: Receive your FTIR reference file links quickly after order confirmation and access your reference data forever through your InstaNANO account with no expiration.
- User-Friendly Outputs: Clean, editable, ready-to-use formats ideal for publication, presentation, theses, lab reports, and industrial documentation.
Why Choose InstaNANO
- Expert Analysis: Prepared by professionals experienced in FTIR spectral interpretation and reference data curation.
- Trusted by Researchers Worldwide: InstaNANO’s analytical services are widely used in academia and industry; our results have been featured in research papers, theses, and technical publications. See citations: https://instanano.com/citations/
- Fast Turnaround: Receive your reference files quickly so you can continue your analysis without delays.
- Hassle-Free Online Experience: Enter your material name(s), place the order, and we handle the rest.
- Lifetime Storage: Your FTIR reference files remain safely stored in your InstaNANO account indefinitely.
NOTE: Please browse our collection of online FTIR services, including data matching, data analysis, graph plotting, and manuscript-ready reports: https://instanano.com/ftir-analysis-online/
NMR Spectra Analysis
Unlock the full potential of your nuclear magnetic resonance (NMR) spectra with a comprehensive, expert-driven analysis tailored to your research needs. Our expert spectroscopists will meticulously process and interpret your raw NMR data—whether proton (1H), carbon (13C), or multi-nuclear experiments—to deliver precise structural elucidation, purity assessment, and quantification insights. This service is ideal for academic researchers, pharmaceutical developers, and materials scientists seeking rigorous, publication-quality results without investing in extensive in-house NMR expertise.
File Upload Guidelines
- Include raw time-domain data (e.g., FID or ser) and any processed files you already have.
- Provide acquisition parameters: nucleus (1H, 13C, etc.), spectrometer frequency, pulse program, number of scans, temperature, solvent, and reference.
- Attach sample information: sample ID, expected compound name or identifier, concentration, and sample volume.
- For multi-dimensional experiments, upload associated 1D experiments and all relevant parameter files.
- Acceptable formats: vendor raw formats or generic formats (JCAMP-DX). Bundle multiple files in a single ZIP archive if possible.
- Label files clearly and include any notes on desired focus (e.g., assignment, purity, quantification).
What You Will Get
- Accurate Structure: Expert interpretation and structural elucidation with assigned chemical shifts for 1H, 13C, and other nuclei.
- Annotated Spectra: Phase- and baseline-corrected, annotated spectra showing peak assignments, multiplicities, and coupling constants.
- Peak List: Tabulated chemical shifts, integrals, multiplicities, and J values delivered in a machine-readable format (CSV).
- Purity & Quantification: Quantification report based on integrals with estimated purity and methodology.
- 2D Correlations: Interpretation and annotation of 2D experiments (e.g., COSY, HSQC, HMBC) when provided.
- Processing Details: Full record of acquisition and processing parameters for reproducibility and publication.
- Deliverable Files: PDF of annotated figures and returned raw/processed files in original or common formats.
- Expert Recommendations: Notes on ambiguous assignments, suggested follow-up experiments, and publication-ready language where applicable.
Why Choose InstaNANO
- Expert spectroscopists with hands-on experience in 1H, 13C, and multi-nuclear NMR analysis.
- Publication-quality processing and reporting tailored to academic, pharmaceutical, and materials science needs.
- Secure handling of your raw data and confidentiality for proprietary projects.
- Fast turnaround with clear, reproducible reporting of methods and parameters.
- Customizable analysis to match specific project goals, from routine assignment to advanced structural elucidation.
NOTE: You may also be interested in our Mass Spectrometry Analysis, FTIR and Raman Services, or Sample Preparation offerings.
Custom Analysis
Please contact us before placing this order so we can understand your custom analysis needs. The current price is for reference only; the final price will vary depending on your requirements. Analysis will be performed as agreed in discussions with our team.
File Upload Guidelines
- Contact us prior to ordering to define the scope, objectives, and any special requirements for your analysis.
- Provide a clear description of the sample, measurement conditions, and the specific analyses you require.
- Upload raw data files or indicate if you will ship physical samples; include sample identifiers and relevant metadata with your files.
- If you are unsure about file types or formats, mention your instrument or software and our team will advise on the best way to share data.
What You Will Get
- Expert Interpretation: Research-grade analysis and interpretation performed by qualified scientists with domain expertise.
- Publication-Ready Files: Clean, structured results suitable for inclusion in manuscripts, presentations, and reports.
- Flexible Output Formats: Data delivered in formats compatible with major scientific software for further analysis or visualization.
- Fast Turnaround: Timely delivery to help you meet research deadlines and project milestones.
- Secure & Confidential Handling: Your files and results are protected and treated with strict confidentiality.
- Lifetime Access: Results remain available in your InstaNANO account for re-download at any time.
Why Choose InstaNANO
- Trusted by Researchers Worldwide: Used by students, researchers, laboratories, and industries; our results are cited in research papers, theses, books, patents, and industrial reports. See citations: https://instanano.com/citations/
- Expert Team With Scientific Experience: Analyses are performed by professionals with strong backgrounds in materials science, spectroscopy, crystallography, nanotechnology, and chemical characterization.
- Fast, Reliable, and High-Quality Services: Services such as FTIR, XRD, Raman, and SEM are delivered with high precision to support your research needs.
- Publication-Ready Outputs: Files compatible with Excel, Word, PowerPoint, Origin, MATLAB, Python, and other major scientific software.
- Secure & Confidential Data Handling: Uploaded files and results are protected and never shared with third parties.
- Lifetime Storage of Results: All results remain permanently accessible in your InstaNANO account.
- Hassle-Free, Fully Online Process: Upload data or ship samples and let our experts handle the rest without the need for specialized software or instruments.
- Wide Range of Analytical Services: From FTIR and XRD to Raman, SEM, UV-Vis, and advanced data analysis, InstaNANO offers a comprehensive suite of services. Explore services: https://instanano.com/analysis-services-online/
NOTE: For related services and more information, visit our analysis services page: https://instanano.com/analysis-services-online/ and our citations page: https://instanano.com/citations/
Scientific Graph Plotting for Publication
Presenting your scientific results clearly is as important as the experiments themselves. Whether your data comes from spectroscopy, microscopy, material characterization, or any analytical technique, InstaNANO transforms raw values into professional, publication-quality graphs. If you are unsure how to plot your results, which graph style is best, or how to format figures for journals, our expert team will create visually appealing, scientifically accurate, and journal-compliant graphs for you.
File Upload Guidelines
- Include raw numerical data with clear column headers and units.
- Preferred data formats: CSV, XLSX, or plain text files; compress multiple files into a ZIP if needed.
- Provide any reference figures or style examples as PNG, TIFF, or PDF to indicate preferred layout or colors.
- Specify desired figure size, aspect ratio, and any journal-specific requirements when placing the order.
- For fitted or processed data, include fitting parameters, peak assignments, and any relevant analysis notes.
What You Will Get
- Publication-Quality Graphs: High-resolution, professionally formatted figures suitable for international journals, conferences, and books.
- Journal Compliance: Figures that meet publication guidelines of major publishers (Elsevier, Springer, ACS, Wiley, Nature, Taylor & Francis, etc.).
- Scientific Standards: Clear axis labels, legends, proper scales, annotations, and consistent color schemes following best practices.
- Resolution: Output prepared at proper resolution (300–600 DPI) for print and digital publication.
- Editable Source Files: Editable/source files provided on request so you can adapt figures later.
- Multiple Output Options: Raster and vector outputs provided as required for publication and presentation.
Why Choose InstaNANO
- Expert Scientific Plotting: Graphs are created by researchers experienced in spectroscopy, microscopy, nanotechnology, materials science, and data visualization—ensuring accuracy and clarity.
- Publication-Ready Output: Figures follow international journal standards with correct formatting, clear labels, and clean visual design preferred by reviewers and editors.
- Trusted by Researchers Worldwide: Used by students, researchers, laboratories, and industries globally; our results appear in research papers, theses, books, patents, and reports. See citations: https://instanano.com/citations/
- Software Compatibility: Outputs compatible with Excel, PowerPoint, Origin, Python, MATLAB, Illustrator, GraphPad, Canva, and other common tools.
- Fast Turnaround: Quick delivery to help you meet paper deadlines and thesis submission timelines.
- Hassle-Free Online Process: Upload your data, specify requirements, and receive perfectly plotted graphs without worrying about formatting.
- Lifetime Storage: All plotted figures remain available in your InstaNANO account for future downloads.
NOTE: Please browse our collection of other online analysis services: https://instanano.com/analysis-services-online/
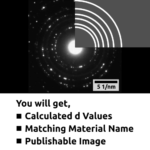
SAED Calculations with Reference Material Matching
You have synthesized your material and want to know whether the images seen in TEM are exactly your synthesized material or an impurity. If two types of material are present in one sample, you want to know which structure corresponds to which material. We will analyze your SAED (Selected Area Electron Diffraction) patterns and, after calculations, match your data with reference materials to determine whether the material shown in the SAED patterns is your material or something else.
File Upload Guidelines
- High-resolution SAED images in TIFF, PNG, or JPEG format (uncompressed preferred).
- Raw diffraction pattern files or original camera output when available.
- Scale bar or calibration details (camera length, pixel size or calibration factor).
- TEM operating conditions (accelerating voltage and any imaging parameters).
- Sample information (composition, synthesis method, and note if multiple phases are suspected).
- Any known or expected reference phases, space group information, or CIF files if available.
What You Will Get
- Calculated d values: Precise d-spacing values extracted from your SAED patterns.
- Reference match: Matched reference material details with identification of phases present and match confidence.
- Publication-ready SAED image: Edited SAED image suitable for direct use in international publications.
- Indexing and phase assignment: Clear indexing of diffraction rings/spots indicating which structure corresponds to which material.
- Summary report: A concise report describing methods, calculations, and matching criteria.
Why Choose InstaNANO
- Specialized experience in SAED analysis and diffraction indexing.
- Access to comprehensive reference databases for reliable matching.
- Publication-standard image preparation and annotation.
- Confidential handling of data and clear, documented results.
- Efficient turnaround with expert interpretation.
NOTE: See also our TEM Image Enhancement and Phase Identification services for complementary support.
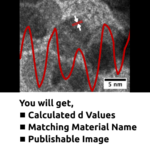
Fringes Calculations with Reference Material Matching
You have synthesized your material and want to confirm whether the features seen in TEM images are your synthesized material or an impurity. If two different materials are present in one sample and you need to determine which structure belongs to which material, we can help. We will analyze your fringes data, calculate d values, and match them with reference materials to determine whether the observed fringes correspond to your material or another phase.
File Upload Guidelines
- Provide high-resolution TEM images or raw microscope files (TIFF, PNG, JPEG, DM3/DM4, SER, MRC) when available.
- Include scale bar or calibration information, imaging parameters (accelerating voltage, camera length), and magnification.
- Mark or describe regions of interest and indicate if multiple phases are suspected.
- Provide any known sample composition, expected phases, or reference patterns to improve matching accuracy.
- If submitting multiple files, compress them into a single ZIP and use clear filenames (sampleID_ROI_description.ext).
What You Will Get
- Calculated d values: Precise d-spacing values derived from your fringes data.
- Reference material match details: Matched phases from reference databases with match confidence and notes on possible impurities or secondary phases.
- Publication-ready fringes image: Edited fringes image suitable for inclusion in international publications, plus a concise analysis summary.
Why Choose InstaNANO
- Specialized expertise in HRTEM fringes analysis and d-spacing calculations.
- Matching against established crystallographic reference data to increase identification confidence.
- Delivery of publication-ready figures and a clear, concise report.
- Confidential handling of your data and support for follow-up questions.
NOTE: For related services see HRTEM Image Processing, Phase Identification & Indexing, and Electron Diffraction Analysis.
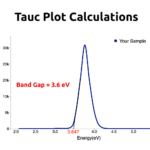
Band gap Calculation from Tauc Plot
If you have synthesized your sample but are having problems with analysis, we will calculate the band gap from the Tauc plot for your sample while you relax at home.
File Upload Guidelines
- Provide optical data as wavelength (nm) or photon energy (eV) with corresponding absorbance, reflectance, or absorption coefficient in CSV or TXT format.
- Indicate whether the material is expected to have a direct or indirect electronic transition.
- Include sample name, measurement units, measurement conditions (e.g., temperature, substrate), and any baseline corrections applied.
- Mention any publication requirements or preferred figure dimensions when uploading files.
What You Will Get
- Band gap value: Band gap value in eV.
- Tauc plot image: Tauc plot image suitable for direct use in international publications.
Why Choose InstaNANO
- Experienced in optical band gap analysis and Tauc plotting.
- Publication-quality figures and clear, concise reporting.
- Confidential handling of your data and timely delivery.
- Support for follow-up questions and minor revisions.
NOTE: You may also be interested in our Optical Characterization and XRD Analysis services.
Custom Image Calculations
You have synthesized your sample and performed microscopy (Optical, SEM, TEM, AFM, STM) but still need quantitative measurements from your images. We provide custom image calculations and analysis for a wide range of microscopy data.
File Upload Guidelines
- Provide original, high-resolution images; uncompressed TIFF is preferred when possible.
- Include scale information (scale bar, pixel size, magnification) or metadata for accurate measurements.
- For color analysis, indicate the color space or provide a reference/standard if available.
- If images have been processed, also upload the raw unprocessed files to verify results.
- State any specific parameters or regions of interest and desired output metrics when submitting files.
What You Will Get
- Accurate Size: Average particle size or diameter calculations with accompanying bar charts and statistical summaries.
- Color Profiling: Color calculations and profiles for regions or full images to quantify color metrics.
- Custom Calculations: Any additional image-based measurements you require, implemented to your specifications.
- Documentation: Clear reporting of methods, assumptions, and results to ensure reproducibility.
Why Choose InstaNANO
- Experienced analysts with expertise across Optical, SEM, TEM, AFM, and STM imaging modalities.
- Quantitative, reproducible workflows and statistical treatment of measurements.
- Flexible, custom solutions tailored to your specific research or quality-control needs.
- Secure handling of data and responsive communication throughout the project.
NOTE: You may also be interested in our related services: Nanoparticle Size Analysis, AFM Image Processing, and Image Enhancement.
XRD Crystallite Size Calculation – Accurate Analysis by Experts
Crystallite (grain) size strongly influences mechanical, optical, electrical, and catalytic properties. If you have recorded an XRD pattern but need accurate crystallite size calculations, InstaNANO’s expert team will process your XRD data using reliable scientific methods to compute crystallite size with rigor and precision.
File Upload Guidelines
- Supported formats: .raw, .xy, .cif, .xrdml, .csv, .txt, etc.
- If your file format is not supported, compress it into a .zip file and upload.
What You Will Get
- Accurate Crystallite Size Calculation: Determined from the five highest-intensity peaks in your XRD pattern; includes the average crystallite size (in nm) and detailed per-peak size distribution.
- Detailed Calculation Report: Peak positions (2θ), FWHM values, and calculated crystallite size for each major reflection, plus graphical plots of the XRD peaks used for calculation and size estimation.
- Ready-to-Use Outputs: Results provided in easy-to-edit formats (Excel, Word, Origin, CSV); graphs and tabulated data ready for inclusion in papers, theses, and reports.
- Lifetime Data Access: Your reports are securely stored in your InstaNANO account and can be accessed anytime.
Why Choose InstaNANO
- Expert Analysis: Performed by a professional team experienced in XRD data analysis and crystallography.
- Trusted by Researchers Worldwide: Our results are recognized across the scientific community and have been cited by leading journals and publishers. See citations: https://instanano.com/citations/
- Secure Uploads: Your data remains safe; only accepted file types are allowed for protection.
- Fast Turnaround: Receive XRD results for research papers within a few days.
- User-Friendly Outputs: Deliverables are ready to use in research papers, presentations, and project reports.
- Hassle-free Online Experience: Upload, relax, and receive complete results.
- Lifetime Storage: Never lose access to your results.
NOTE: Please browse our collection of online XRD services, including data matching, data analysis, phase identification, and Rietveld refinement: https://instanano.com/xrd-analysis-online/
XRD Percent Crystallinity Calculation – Accurate & Reliable Results by Experts
Determining percent crystallinity is crucial for understanding material properties such as mechanical strength, optical behavior, and thermal stability. At InstaNANO, we derive crystallinity values with scientific rigor so you can make data-driven conclusions with confidence. Upload your XRD data securely and our specialists will analyze your diffraction pattern using validated methods to determine accurate percent crystallinity, ready for inclusion in your research or publication.
File Upload Guidelines
- Supported formats: .raw, .xy, .cif, .xrdml, .csv, .txt, etc.
- If your file format is not supported, compress it into a .zip file and upload.
What You Will Get
- Accurate Percent Crystallinity Value: Get the exact percentage of crystalline and amorphous phases in your sample, calculated using advanced baseline correction and peak deconvolution methods for reliable results.
- Detailed Calculation Report: Includes graphical representation of fitted peaks and the amorphous background, and provides all key parameters: crystalline area, amorphous area, and final percent crystallinity.
- Ready-to-Use Outputs: Results provided in easy-to-edit formats (Excel, Word, Origin, CSV); graphs and tabulated data ready for inclusion in papers, theses, and reports.
- Lifetime Data Access: Your crystallinity results are stored permanently in your InstaNANO account and remain accessible for comparison or citation.
Why Choose InstaNANO
- Expert Analysis: Performed by a professional team with experience in XRD data analysis and crystallography.
- Trusted by Researchers Worldwide: The reliability of InstaNANO’s results is recognized across the scientific community; our analyses have been cited by leading journals and publishers, demonstrating precision and credibility. See citations: https://instanano.com/citations/
- Secure Uploads: Your data remains safe; only accepted file types are allowed for protection.
- Fast Turnaround: Get your XRD results for research papers within a few days.
- User-Friendly Outputs: Ready to use in your research papers, presentations, and project reports.
- Hassle-free online experience: Upload, relax, and receive complete results.
- Lifetime Storage: Never lose access to your results.
NOTE: Please browse our collection of online XRD services, including data matching, data analysis, phase identification, and Rietveld refinement: https://instanano.com/xrd-analysis-online/
BET Analysis Online
You have synthesized your material and performed the BET, but are having problems with your sample's BET analysis. Our expert team is here to help and perform all BET-related calculations for you.
File Upload Guidelines
- Provide raw adsorption/desorption isotherm data with relative pressure (P/P0) and adsorbed volume columns.
- Accepted file formats: CSV, TXT, XLS/XLSX.
- Include sample mass, units, degas temperature and time, and measurement temperature.
- Mention instrument model and any preprocessing performed on the data.
- If data is large, compress files (ZIP) before upload and remove any personally identifiable information.
What You Will Get
- Surface Area: BET surface area reported (m²/g) with BET plot and fitting range.
- Pore Size: Pore size distribution (nm) derived from the isotherm data; method noted in the report.
- Pore Volume: Total and partial pore volumes (cm³/g) from adsorption data.
- Pore Shape: Interpretation of pore shape and morphology based on isotherm features and hysteresis.
Why Choose InstaNANO
- Experienced analysts with standardized BET and pore analysis protocols.
- Clear reports including plots, fitting parameters, and raw data export.
- Flexible methods (BJH/DFT or other) selected based on data quality and sample type.
- Fast turnaround and confidential handling of your data.
NOTE: For complementary services, see Surface Area Measurement, Pore Characterization, and TEM/SEM Imaging.